Nontraded REIT Fundraising Up 15.9% Year Over Year Through September

Publicly registered nontraded real estate investment trusts raised $5.0 billion through September 2026, up 15.9% year over year, while net asset value REITs posted third-quarter gains as listed REIT benchmarks declined, according to investment banking firm Robert A. Stanger & Co.
The Stanger Public NAV REIT Total Return Index (18 NAV REITs; 81 separate share classes) rose 1.6% in Q3 2026, its seventh consecutive quarterly gain. The Stanger Composite NAV REIT Total Return Index (35 NAV REITs; 165 separate share classes), which incorporates both publicly registered and private placement NAV REITs, gained 1.8% in Q3, its 11th consecutive positive quarter. By contrast, the three major listed REIT benchmarks tracked by Stanger averaged a 6.2% decline for the quarter after an 11.5% average gain in Q2.
Total returns for the Stanger NAV REIT indices and the listed REIT benchmark average are summarized below.
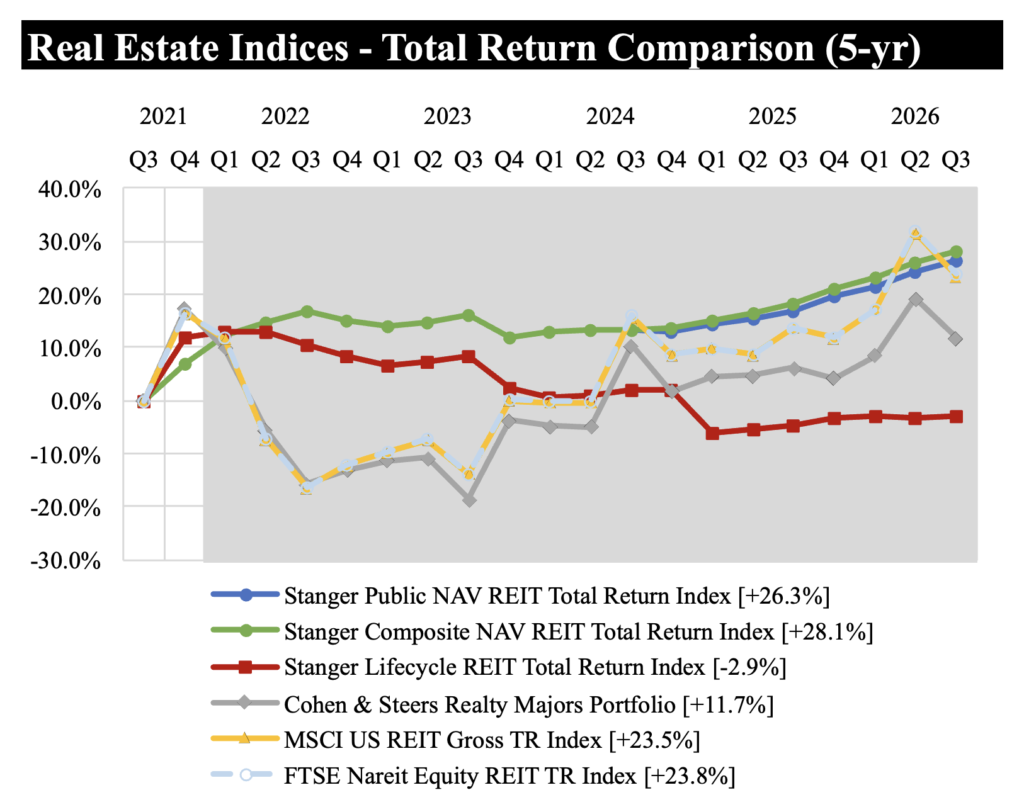
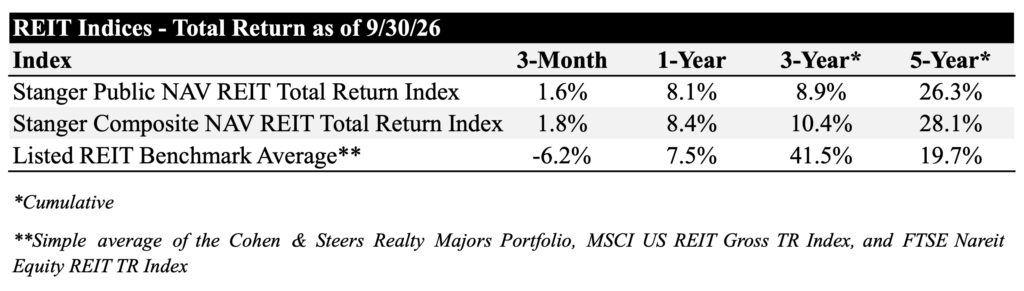 The Stanger NAV REIT indices also outperformed the traded REIT benchmark average over the one- and five-year periods but trailed substantially over three years. The three-year comparison is influenced by the timing of the 2023 market downturn: traded REITs declined sharply just before the measurement period began, then rebounded in Q4 2023 as nontraded NAV REIT returns turned negative.
 Alongside positive performance, fundraising for publicly registered nontraded REITs continued to grow. Year-to-date gross sales reached $5.0 billion through September 2026, up 15.9% from the $4.3 billion raised over the same period in 2025. Trailing 12-month fundraising reached $6.4 billion, up 9.4% year over year, with Blackstone accounting for $3.1 billion, or 48% of the total.
“Listed REITs and NAV REITs reflect real estate value through different lenses,” said Kevin T. Gannon, chairman and chief executive officer of Stanger. “NAV REIT valuations are based on underlying private real estate values and operating fundamentals, while listed REIT prices move with daily swings in the broader stock market. That difference was clear this quarter, as the major listed REIT benchmarks fell an average of 6.2% while NAV REITs continued to post gains. What stands out is the consistency of NAV REIT returns, now paired with improving fundraising. We believe that combination positions the sector well heading into 2027.”
Performance leaders across key time periods are summarized in the table below.
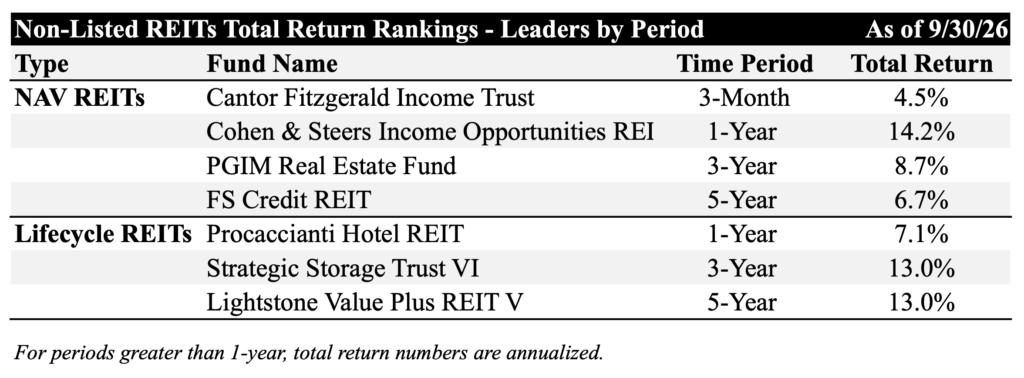 The third-quarter results extend a run of positive returns AltsWire reported in July. In the second quarter, the Stanger Public NAV REIT Total Return Index rose 2.4%, its strongest quarterly gain in more than four years and its sixth consecutive quarterly advance. PGIM Real Estate Fund Inc., which led the three-year NAV REIT period at 9.3% in that edition, held the top spot through Sept. 30 with an 8.7% annualized return. On the private placement side, AltsWire reported in August that private placement REITs raised $4.8 billion in the first half of 2026, up 11.8% year over year. The Stanger Private NAV REIT Total Return Index gained 2.3% in the second quarter and 10.1% over the trailing 12 months.
Cantor Fitzgerald Income Trust led all NAV REITs over the three-month period with a 4.5% total return. As previously reported, the REIT cut its asset management fee from 1.2% to 0.75% of NAV and its performance participation allocation from 12.5% to 5% of total return, effective Jan. 1, 2026. FS Credit Real Estate Income Trust topped the five-year period with a 6.7% annualized return. The program launched a new $2.5 billion continuous public offering in June after its registration statement went effective June 2. Among lifecycle REITs, Strategic Storage Trust VI again led the three-year period with a 13% annualized return. In July, SST VI agreed to acquire Strategic Storage Growth Trust III in an all-stock merger expected to close in the fourth quarter of 2026, subject to SSGT III stockholder approval.
The Composite NAV REIT Total Return Index, Public NAV REIT Total Return Index, and Lifecycle REIT Total Return Index (12 lifecycle REITs; 25 separate share classes) measure the performance of nontraded REITs on a quarterly basis. Stanger began calculating these indices on Dec. 31, 2015, with a base level of 100. For a share class to be included in any index, a minimum of one full calendar quarter of performance is required.
Founded in 1978, Robert A. Stanger & Co. Inc. is an investment banking firm providing advisory, valuation, and capital markets services to real estate investment trusts, partnerships, and related entities.
Visit the AltsWire directory page.