
Credit Interval Fund Redemptions Echo BDCs; PE/VC Strategies Lead, Says Stanger

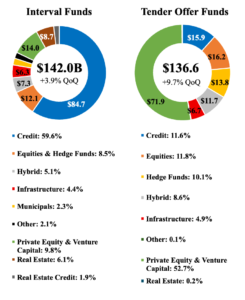
Nontraded closed-end funds reached $279 billion in aggregate net asset value in the third quarter of 2026, a 6.7% quarter-over-quarter increase, according to Robert A. Stanger & Co. Tender offer funds grew 9.7% to $136.6 billion, outpacing interval funds, which increased 3.9% to $142 billion. The gap reflects where capital is moving: private equity and venture capital funds account for 52.7% of tender offer fund NAV, while credit-focused funds represent 59.6% of interval fund NAV.
Aggregate NAV by investment focus for interval funds and tender offer funds is summarized below.
Through August 2026, credit interval fund redemptions rose nearly 89% year-over-year to $9.6 billion, equal to 79% of the category’s gross sales, compared with 26% a year earlier. Net sales of credit interval funds fell 83% to $2.6 billion, and net sales of credit tender offer funds declined 15% to $1.8 billion.
Stanger’s latest analysis provides the first update to its fund-level redemption data for the 25 largest credit interval funds. Among the 17 funds with third-quarter results, sponsors returned approximately $3 billion to investors, or 4.6% of Stanger’s estimated repurchase offer NAV basis, compared with 4.8% for the same funds in the prior quarter. Among third-quarter reporters that disclosed requests in both quarters, requests as a percentage of NAV declined at six of nine funds and rose at two, though demand continues to exceed quarterly repurchase capacity at several major funds.
Cliffwater Corporate Lending Fund, the largest interval fund, received third-quarter requests of approximately 16% of NAV, according to recent reports, down from 17% in the second quarter, and repurchased up to its 5% quarterly cap, or approximately $1.6 billion, leaving an estimated $3.4 billion in requests unmet. Year-to-date, the fund has returned nearly $5.5 billion to investors.
“Credit interval funds are showing some of the same liquidity pressures we have tracked in non-listed [business development companies],” said Kevin T. Gannon, chairman and chief executive officer of Stanger. “Sponsors continue to return substantial capital, but with new fundraising slowing, redemptions are absorbing a much greater share of sales. Unlike NAV BDCs, however, the category remains positive in net sales.”
In contrast, private equity and venture capital strategies are attracting a large share of new capital, accounting for nearly half of year-to-date tender offer fund gross sales through August. Among interval funds, they also lead on performance, producing the top-performing fund in each trailing period and accounting for six of the top 10 performers for longer than 12 months.
Available company-level holdings data offer some insight into select leaders, with companies like SpaceX, OpenAI, and Anthropic among the holdings of top performers. “Capital is following performance into private equity and venture capital,” Gannon said. “The open question is how much of that performance reflects recent enthusiasm around AI and a small number of high-profile technology holdings. Investors should understand what is driving headline returns before chasing them.”
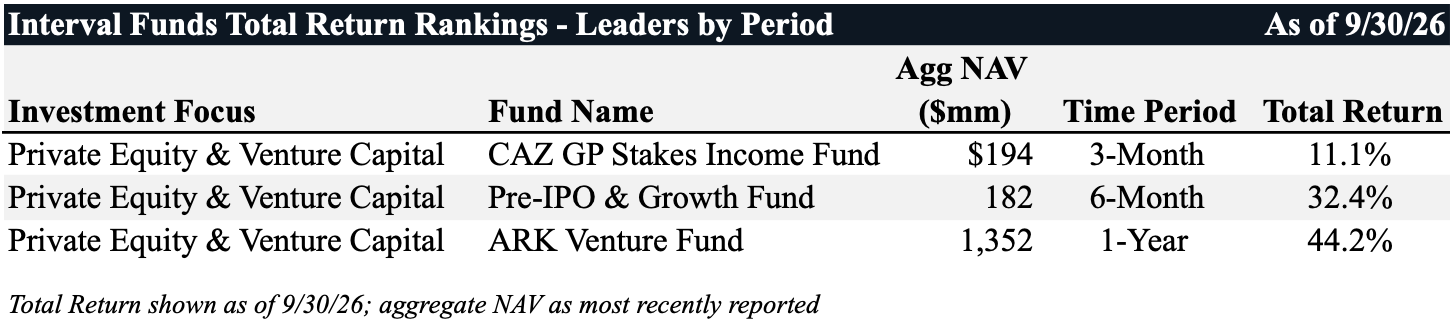
Interval fund performance leaders across three-month (CAZ GP Stakes Income Fund, which was renamed in September), six-month (Pre-IPO & Growth Fund), and one-year (ARK Venture Fund) time periods are summarized below.
Founded in 1978, Robert A. Stanger & Co. Inc. is an investment banking firm providing advisory, valuation, and capital markets services to real estate investment trusts, partnerships, and related entities.
Visit the AltsWire directory page.